Lupus – Cytokine Dictionary#
import time
import warnings
import numpy as np
import pandas as pd
import scanpy as sc

from tqdm import TqdmWarning

import hucira as hc

warnings.simplefilter("ignore", TqdmWarning)

start = time.time()
/lustre/groups/ml01/workspace/jenni.liu/conda_extern/envs/hucira/lib/python3.11/site-packages/tqdm/auto.py:21: TqdmWarning: IProgress not found. Please update jupyter and ipywidgets. See https://ipywidgets.readthedocs.io/en/stable/user_install.html
  from .autonotebook import tqdm as notebook_tqdm
The Human Cytokine Dictionary#
The Human Cytokine Dictionary (hcd) can be accessed through this module. Your query data should be a transcriptomic data object in AnnData’s .h5ad format with gene symbols in .var axis and metadata describing immune celltypes and experimental conditions of samples. Using the Human Cytokine Dictionary as reference, you can “look up” cytokine responses of the disease states in your own dataset.
1. Load input data#
The two main input files for this tool are:
the Human Cytokine Dictionary
your transcriptome data object
Explore their metadata annotation for cell types and disease condition.
#### Load the human cytokine dictionary

df_hcd_all = hc.load_human_cytokine_dict()

print(f"All celltypes in dictionary:\n  {df_hcd_all.celltype.unique()}")
print("\n")
print(f"All cytokines in dictionary:\n  {df_hcd_all.cytokine.unique()}")

df_hcd_all.head()
Loading from: /ictstr01/home/icb/jenni.liu/all_projects/cytokine_dict_project/human_cytokine_dict.csv
All celltypes in dictionary:
  ['Intermediate_B_cell' 'NKT' 'CD8_Memory_T_cell' 'NK_CD56low' 'CD16_Mono'
 'NK_CD56hi' 'CD8_Naive_T_cell' 'pDC' 'ILC' 'MAIT' 'Naive_B_cell'
 'CD4_Naive_T_cell' 'Treg' 'Plasmablast' 'Granulocyte' 'B_cell'
 'CD4_T_cell' 'HSPC' 'CD8_T_cell' 'CD14_Mono' 'cDC' 'CD4_Memory_T_cell'
 'NK' 'Mono']


All cytokines in dictionary:
  ['4-1BBL' 'ADSF' 'APRIL' 'BAFF' 'C3a' 'C5a' 'CD27L' 'CD30L' 'CD40L' 'CT-1'
 'Decorin' 'EGF' 'EPO' 'FGF-beta' 'FLT3L' 'FasL' 'G-CSF' 'GDNF' 'GITRL'
 'GM-CSF' 'HGF' 'IFN-alpha1' 'IFN-beta' 'IFN-epsilon' 'IFN-gamma'
 'IFN-lambda1' 'IFN-lambda2' 'IFN-lambda3' 'IFN-omega' 'IGF-1'
 'IL-1-alpha' 'IL-1-beta' 'IL-10' 'IL-11' 'IL-12' 'IL-13' 'IL-15' 'IL-16'
 'IL-17A' 'IL-17B' 'IL-17C' 'IL-17D' 'IL-17E' 'IL-17F' 'IL-18' 'IL-19'
 'IL-1Ra' 'IL-2' 'IL-20' 'IL-21' 'IL-22' 'IL-23' 'IL-24' 'IL-26' 'IL-27'
 'IL-3' 'IL-31' 'IL-32-beta' 'IL-33' 'IL-34' 'IL-35' 'IL-36-alpha'
 'IL-36Ra' 'IL-4' 'IL-5' 'IL-6' 'IL-7' 'IL-8' 'IL-9' 'LIF' 'LIGHT'
 'LT-alpha1-beta2' 'LT-alpha2-beta1' 'Leptin' 'M-CSF' 'Noggin' 'OSM'
 'OX40L' 'PRL' 'PSPN' 'RANKL' 'SCF' 'TGF-beta1' 'TL1A' 'TNF-alpha' 'TPO'
 'TRAIL' 'TSLP' 'TWEAK' 'VEGF']
| gene | log_fc | logCPM | F | p_value | adj_p_value | contrast | celltype | cytokine | num_donors | median_num_cells_pbs | median_num_cells_cytokine | mean_num_cells_pbs | mean_num_cells_cytokine | min_num_cells_pbs | min_num_cells_cytokine | max_num_cells_pbs | max_num_cells_cytokine | num_DE_pbs_wells | well_biased | |
|---|---|---|---|---|---|---|---|---|---|---|---|---|---|---|---|---|---|---|---|---|
| 90 | A1BG-AS1 | -0.238704 | 3.888135 | 3.040818 | 0.093012 | 0.433379 | NaN | Intermediate_B_cell | 4-1BBL | 12.0 | 1435.5 | 215.5 | 1814.333333 | 307.166667 | 367.0 | 60.0 | 4609.0 | 864.0 | 0.0 | False |
| 91 | A1BG-AS1 | -0.077966 | 3.918833 | 0.396225 | 0.535585 | 0.791563 | NaN | Intermediate_B_cell | ADSF | 12.0 | 1435.5 | 264.0 | 1814.333333 | 299.750000 | 367.0 | 53.0 | 4609.0 | 692.0 | 0.0 | False |
| 92 | A1BG-AS1 | -0.208858 | 3.911595 | 2.522081 | 0.124235 | 0.408307 | NaN | Intermediate_B_cell | APRIL | 12.0 | 1435.5 | 167.0 | 1814.333333 | 195.166667 | 367.0 | 55.0 | 4609.0 | 482.0 | 0.0 | False |
| 93 | A1BG-AS1 | -0.293355 | 3.897822 | 6.232523 | 0.019998 | 0.098003 | NaN | Intermediate_B_cell | BAFF | 12.0 | 1435.5 | 203.5 | 1814.333333 | 209.250000 | 367.0 | 74.0 | 4609.0 | 450.0 | 2.0 | False |
| 94 | A1BG-AS1 | -0.287312 | 3.909828 | 3.914004 | 0.058553 | 0.374818 | NaN | Intermediate_B_cell | C3a | 12.0 | 1435.5 | 202.5 | 1814.333333 | 233.166667 | 367.0 | 78.0 | 4609.0 | 529.0 | 0.0 | False |
#### Load the query adata object

adata = hc.load_lupus_data()
adata
Loading from: /ictstr01/home/icb/jenni.liu/all_projects/cytokine_dict_project/lupus.h5ad
AnnData object with n_obs × n_vars = 1263676 × 30172
    obs: 'library_uuid', 'assay_ontology_term_id', 'mapped_reference_annotation', 'is_primary_data', 'cell_type_ontology_term_id', 'author_cell_type', 'cell_state', 'sample_uuid', 'tissue_ontology_term_id', 'development_stage_ontology_term_id', 'disease_state', 'suspension_enriched_cell_types', 'suspension_uuid', 'suspension_type', 'donor_id', 'self_reported_ethnicity_ontology_term_id', 'disease_ontology_term_id', 'sex_ontology_term_id', 'Processing_Cohort', 'ct_cov', 'ind_cov', 'tissue_type', 'cell_type', 'assay', 'disease', 'sex', 'tissue', 'self_reported_ethnicity', 'development_stage', 'observation_joinid'
    var: 'feature_is_filtered', 'feature_name', 'feature_reference', 'feature_biotype', 'feature_length', 'feature_type'
    uns: 'citation', 'default_embedding', 'organism', 'organism_ontology_term_id', 'schema_reference', 'schema_version', 'title'
    obsm: 'X_pca', 'X_umap'
#### For easy workflow:
# Enter celltype column name and condition column name

your_celltype_colname = "cell_type"
your_contrast_colname = "disease_state"


# Check data size (Are the conditions you want to contrast of comparable size?)
adata.obs[your_contrast_colname].value_counts()
disease_state
managed    696626
na         486418
flare       55120
treated     25512
Name: count, dtype: int64
# Enrichment analysis needs two main information from query adata: cell types and disease conditions.
# They have to be chosen manually, because annotation of objects differs.

print(f"All celltypes in query data:\n  {sorted(adata.obs[your_celltype_colname].unique())}\n")
print(
    f"All experimental states (contrasts/conditions) in query data:\n  {sorted(adata.obs[your_contrast_colname].unique())}\n"
)
All celltypes in query data:
  ['B cell', 'CD4-positive, alpha-beta T cell', 'CD8-positive, alpha-beta T cell', 'classical monocyte', 'conventional dendritic cell', 'lymphocyte', 'natural killer cell', 'non-classical monocyte', 'plasmablast', 'plasmacytoid dendritic cell', 'progenitor cell']

All experimental states (contrasts/conditions) in query data:
  ['flare', 'managed', 'na', 'treated']
2. Process and prepare input data parameters#
Proe-process data and convert ENSG to gene symbols if necessary
Because there is no standard nomenclature for cell types, we have to manually create “celltype_combos”, the data container that matches the cell types of your query data to the cell types of the hcd.
Choose the experimental conditions of interest (“contrasts”)
#### Query data needs to be pre-processed

adata.layers["counts"] = adata.raw.X
adata.layers["scaled_original_counts"] = adata.X
adata.X = adata.layers["counts"]

# Basic quality checks:
sc.pp.filter_cells(adata, min_genes=200)
sc.pp.filter_genes(adata, min_cells=3)

# Log-normalize:
sc.pp.normalize_total(adata)
sc.pp.log1p(adata)

adata
AnnData object with n_obs × n_vars = 1263438 × 24085
    obs: 'library_uuid', 'assay_ontology_term_id', 'mapped_reference_annotation', 'is_primary_data', 'cell_type_ontology_term_id', 'author_cell_type', 'cell_state', 'sample_uuid', 'tissue_ontology_term_id', 'development_stage_ontology_term_id', 'disease_state', 'suspension_enriched_cell_types', 'suspension_uuid', 'suspension_type', 'donor_id', 'self_reported_ethnicity_ontology_term_id', 'disease_ontology_term_id', 'sex_ontology_term_id', 'Processing_Cohort', 'ct_cov', 'ind_cov', 'tissue_type', 'cell_type', 'assay', 'disease', 'sex', 'tissue', 'self_reported_ethnicity', 'development_stage', 'observation_joinid', 'n_genes'
    var: 'feature_is_filtered', 'feature_name', 'feature_reference', 'feature_biotype', 'feature_length', 'feature_type', 'n_cells'
    uns: 'citation', 'default_embedding', 'organism', 'organism_ontology_term_id', 'schema_reference', 'schema_version', 'title', 'log1p'
    obsm: 'X_pca', 'X_umap'
    layers: 'counts', 'scaled_original_counts'
#### query adata object needs to have gene symbols as adata.var.index. The Lupus data object didin't
import mygene

mg = mygene.MyGeneInfo()

results = mg.querymany(adata.var_names.tolist(), scopes="ensembl.gene", fields="symbol", species="human")

df = pd.DataFrame(results)

# Create mapping dict (fallback to Ensembl ID when symbol missing)
ensembl_to_symbol = df.set_index("query")["symbol"].fillna(df["query"]).to_dict()

adata.var["gene_symbol"] = adata.var_names.map(ensembl_to_symbol)
adata.var_names_make_unique()

# 1. Keep only rows with a gene symbol
keep_idx = ~adata.var["gene_symbol"].isna()
adata = adata[:, keep_idx].copy()

# 2. Identify duplicate gene symbols
dup_idx = adata.var["gene_symbol"].duplicated(keep="first")

# 3. Keep only the first occurrence of each gene symbol
adata = adata[:, ~dup_idx].copy()

# 4. Set gene_symbol as the new var index
adata.var_names = adata.var["gene_symbol"]
querying 1-1000...done.
querying 1001-2000...done.
querying 2001-3000...done.
querying 3001-4000...done.
querying 4001-5000...done.
querying 5001-6000...done.
querying 6001-7000...done.
querying 7001-8000...done.
querying 8001-9000...done.
querying 9001-10000...done.
querying 10001-11000...done.
querying 11001-12000...done.
querying 12001-13000...done.
querying 13001-14000...done.
querying 14001-15000...done.
querying 15001-16000...done.
querying 16001-17000...done.
querying 17001-18000...done.
querying 18001-19000...done.
querying 19001-20000...done.
querying 20001-21000...done.
querying 21001-22000...done.
querying 22001-23000...done.
querying 23001-24000...done.
querying 24001-24085...done.
Finished.
10 input query terms found dup hits:
	[('ENSG00000228044', 2), ('ENSG00000261600', 2), ('ENSG00000234162', 2), ('ENSG00000227110', 2), ('E
5 input query terms found no hit:
	['ENSG00000250410', 'ENSG00000168078', 'ENSG00000266957', 'ENSG00000189144', 'ENSG00000267058']
Pass "returnall=True" to return complete lists of duplicate or missing query terms.
#### Create celltype_combos. An input parameter for the enrichment analysis.

adata_celltypes = [
    "B cell",
    "CD8-positive, alpha-beta T cell",
    "classical monocyte",
    "non-classical monocyte",
    "natural killer cell",
]

hcd_celltypes = ["B_cell", "CD8_T_cell", "CD14_Mono", "CD16_Mono", "NK_CD56hi"]

celltype_combos = hc.create_celltype_combos(adata_celltypes, hcd_celltypes)
celltype_combos
(('B cell', 'B_cell'),
 ('CD8-positive, alpha-beta T cell', 'CD8_T_cell'),
 ('classical monocyte', 'CD14_Mono'),
 ('non-classical monocyte', 'CD16_Mono'),
 ('natural killer cell', 'NK_CD56hi'))
#### Define conditions of interest:

contrasts = [("flare", "na"), ("flare", "treated")]
3. Run enrichment analysis#
The main analysis is done by run_one_enrichment_test(), which computes enrichment scores of one query celltype and different conditions.
This simple example returns an example of the main outcome of this cytokine enrichment score analysis.
run_one_enrichment_test() returns enrichment results for one celltype and contrast.
get_robust_significant_results() returns the robust and significant results from that initial enrichment analysis.
#### Run enrichment analysis on a single celltype and condition:


enrichment_results = hc.run_one_enrichment_test(
    adata=adata,
    df=df_hcd_all,
    contrasts_combo=contrasts,
    celltype_combo=celltype_combos[0],
    contrast_column=your_contrast_colname,
    celltype_column=your_celltype_colname,
    direction="upregulated",
    threshold_lfc=0.8,
    threshold_expression=0.05,
    threshold_pval=0.01,
)

# Look at all enrichment results (reduced view to columns of interest, not all statistics)
enrichment_results[
    [
        "celltype_combo",
        "cytokine",
        "contrast",
        "direction",
        "ES",
        "NES",
        "NOM p-val",
        "FDR q-val",
        "FWER p-val",
        "frac_shared_genes_signature",
    ]
].sort_values("NES", ascending=False)
Computing gene sets of Human Cytokine Dictionary for B_cell.
Using precomputed stats
Using precomputed stats
flare_vs_na
flare_vs_treated
| celltype_combo | cytokine | contrast | direction | ES | NES | NOM p-val | FDR q-val | FWER p-val | frac_shared_genes_signature | |
|---|---|---|---|---|---|---|---|---|---|---|
| 0 | B cell (B_cell) | IFN-beta | flare_vs_na | upregulated | 0.76755 | 2.610953 | 0.0 | 0.0 | 0.0 | 0.237705 |
| 1 | B cell (B_cell) | IL-15 | flare_vs_na | upregulated | 0.780095 | 2.361521 | 0.0 | 0.0 | 0.0 | 0.211921 |
| 2 | B cell (B_cell) | IFN-omega | flare_vs_na | upregulated | 0.767752 | 2.265895 | 0.0 | 0.0 | 0.0 | 0.186667 |
| 3 | B cell (B_cell) | IL-2 | flare_vs_na | upregulated | 0.896996 | 2.200793 | 0.0 | 0.0 | 0.0 | 0.186441 |
| 4 | B cell (B_cell) | IL-1-beta | flare_vs_na | upregulated | 0.538471 | 1.63126 | 0.014342 | 0.013212 | 0.047 | 0.371795 |
| 5 | B cell (B_cell) | IL-21 | flare_vs_na | upregulated | 0.663778 | 1.543598 | 0.022758 | 0.029145 | 0.119 | 0.153846 |
| 10 | B cell (B_cell) | IL-4 | flare_vs_treated | upregulated | 0.401494 | 1.379573 | 0.060311 | 0.290104 | 0.305 | 0.152027 |
| 6 | B cell (B_cell) | CD40L | flare_vs_na | upregulated | 0.490827 | 1.178586 | 0.257895 | 0.282013 | 0.749 | 0.157143 |
| 7 | B cell (B_cell) | IL-4 | flare_vs_na | upregulated | 0.346167 | 1.151597 | 0.249389 | 0.280926 | 0.798 | 0.152027 |
| 11 | B cell (B_cell) | IL-15 | flare_vs_treated | upregulated | 0.354657 | 1.119167 | 0.319231 | 0.463624 | 0.677 | 0.211921 |
| 12 | B cell (B_cell) | IL-2 | flare_vs_treated | upregulated | 0.447116 | 1.10276 | 0.348276 | 0.326254 | 0.692 | 0.186441 |
| 15 | B cell (B_cell) | IFN-beta | flare_vs_treated | upregulated | -0.268392 | -0.996988 | 0.464853 | 0.461388 | 0.790072 | 0.237705 |
| 14 | B cell (B_cell) | IL-21 | flare_vs_treated | upregulated | -0.43976 | -1.060919 | 0.393593 | 0.470761 | 0.714581 | 0.153846 |
| 13 | B cell (B_cell) | IFN-omega | flare_vs_treated | upregulated | -0.343858 | -1.092768 | 0.335802 | 0.567058 | 0.678387 | 0.186667 |
| 9 | B cell (B_cell) | CD40L | flare_vs_treated | upregulated | -0.690159 | -1.693557 | 0.021459 | 0.026581 | 0.038263 | 0.157143 |
| 8 | B cell (B_cell) | IL-1-beta | flare_vs_treated | upregulated | -0.600849 | -1.906926 | 0.002278 | 0.006995 | 0.005171 | 0.371795 |
#### Lastly, get robust and significant results from previous enrichment_results

robust_results_dict = hc.get_robust_significant_results(
    results=enrichment_results,
    alphas=[0.1, 0.05, 0.01],
    threshold_valid=0.1,
    threshold_below_alpha=0.9,
    display_df_nicely=True,
)
100%|█████████████████████████████████████████████| 2/2 [00:00<00:00, 14.59it/s]
100%|█████████████████████████████████████████████| 2/2 [00:00<00:00, 26.67it/s]
100%|█████████████████████████████████████████████| 2/2 [00:00<00:00, 26.47it/s]
Contrast:flare_vs_na
Contrast:flare_vs_treated
| celltype_combo | B cell (B_cell) |
|---|---|
| cytokine | |
| CD40L | 1.178586 |
| IFN-beta | 2.610953 |
| IFN-omega | 2.265895 |
| IL-1-beta | 1.631260 |
| IL-15 | 2.361521 |
| IL-2 | 2.200793 |
| IL-21 | 1.543598 |
| IL-4 | 1.151597 |
| celltype_combo | B cell (B_cell) |
|---|---|
| cytokine | |
| CD40L | -1.693557 |
| IFN-beta | -0.996988 |
| IFN-omega | -1.092768 |
| IL-1-beta | -1.906926 |
| IL-15 | 1.119167 |
| IL-2 | 1.102760 |
| IL-21 | -1.060919 |
| IL-4 | 1.379573 |
4. Visualization of results#
run_all_enrichment_test() iterates the enrichment analysis over several cell types and gene set thresholds for the enrichment analysis, resuting in more robust results. The output is ideal for visualization of:
Heatmaps, representing normalized enrichment scores and significant annotations.
Cell-cell communication plot, representing cell communication through cytokines.
#### Run more robust enrichment analysis on a several celltypes and conditions:

all_enrichment_results = hc.run_all_enrichment_test(
    adata=adata,
    df=df_hcd_all,
    contrasts_combo=contrasts,
    celltype_combos=celltype_combos,
    contrast_column=your_contrast_colname,
    celltype_column=your_celltype_colname,
    direction="upregulated",
    threshold_lfc=[0.8, 1],
    threshold_expression=[0.05],
)

# Look at all enrichment results (reduced view to columns of interest, not all statistics)
all_enrichment_results[
    [
        "celltype_combo",
        "cytokine",
        "contrast",
        "direction",
        "ES",
        "NES",
        "NOM p-val",
        "FDR q-val",
        "FWER p-val",
        "frac_shared_genes_signature",
    ]
].sort_values("NES", ascending=False)
Computing gene sets of Human Cytokine Dictionary for B_cell.
Using precomputed stats
Using precomputed stats
flare_vs_na
flare_vs_treated
Computing gene sets of Human Cytokine Dictionary for B_cell.
Using precomputed stats
Using precomputed stats
flare_vs_na
flare_vs_treated
Computing gene sets of Human Cytokine Dictionary for CD8_T_cell.
Using precomputed stats
Using precomputed stats
flare_vs_na
flare_vs_treated
Computing gene sets of Human Cytokine Dictionary for CD8_T_cell.
Using precomputed stats
Using precomputed stats
flare_vs_na
flare_vs_treated
Computing gene sets of Human Cytokine Dictionary for CD14_Mono.
Using precomputed stats
Using precomputed stats
flare_vs_na
flare_vs_treated
Computing gene sets of Human Cytokine Dictionary for CD14_Mono.
Using precomputed stats
Using precomputed stats
flare_vs_na
flare_vs_treated
Computing gene sets of Human Cytokine Dictionary for CD16_Mono.
Using precomputed stats
Using precomputed stats
flare_vs_na
flare_vs_treated
Computing gene sets of Human Cytokine Dictionary for CD16_Mono.
Using precomputed stats
Using precomputed stats
flare_vs_na
flare_vs_treated
Computing gene sets of Human Cytokine Dictionary for NK_CD56hi.
Using precomputed stats
Using precomputed stats
flare_vs_na
flare_vs_treated
Computing gene sets of Human Cytokine Dictionary for NK_CD56hi.
Using precomputed stats
Using precomputed stats
flare_vs_na
flare_vs_treated
| celltype_combo | cytokine | contrast | direction | ES | NES | NOM p-val | FDR q-val | FWER p-val | frac_shared_genes_signature | |
|---|---|---|---|---|---|---|---|---|---|---|
| 0 | CD8-positive, alpha-beta T cell (CD8_T_cell) | IL-2 | flare_vs_na | upregulated | 0.782699 | 3.022191 | 0.0 | 0.0 | 0.0 | 0.360000 |
| 0 | CD8-positive, alpha-beta T cell (CD8_T_cell) | IL-15 | flare_vs_na | upregulated | 0.779403 | 3.009335 | 0.0 | 0.0 | 0.0 | 0.311728 |
| 1 | CD8-positive, alpha-beta T cell (CD8_T_cell) | IL-2 | flare_vs_na | upregulated | 0.820125 | 2.899078 | 0.0 | 0.0 | 0.0 | 0.347305 |
| 0 | natural killer cell (NK_CD56hi) | IFN-beta | flare_vs_na | upregulated | 0.838612 | 2.861952 | 0.0 | 0.0 | 0.0 | 0.283721 |
| 1 | CD8-positive, alpha-beta T cell (CD8_T_cell) | IFN-omega | flare_vs_na | upregulated | 0.802527 | 2.858758 | 0.0 | 0.0 | 0.0 | 0.236842 |
| ... | ... | ... | ... | ... | ... | ... | ... | ... | ... | ... |
| 8 | CD8-positive, alpha-beta T cell (CD8_T_cell) | IL-1-beta | flare_vs_treated | upregulated | -0.840144 | -2.234828 | 0.0 | 0.0 | 0.0 | 0.395833 |
| 13 | non-classical monocyte (CD16_Mono) | IFN-beta | flare_vs_treated | upregulated | -0.535535 | -2.293414 | 0.0 | 0.0 | 0.0 | 0.232719 |
| 8 | natural killer cell (NK_CD56hi) | IFN-beta | flare_vs_treated | upregulated | -0.609525 | -2.302386 | 0.0 | 0.0 | 0.0 | 0.290323 |
| 17 | non-classical monocyte (CD16_Mono) | IL-1-beta | flare_vs_treated | upregulated | -0.584103 | -2.340047 | 0.0 | 0.0 | 0.0 | 0.308370 |
| 9 | CD8-positive, alpha-beta T cell (CD8_T_cell) | IL-1-beta | flare_vs_treated | upregulated | -0.774126 | -2.358371 | 0.0 | 0.0 | 0.0 | 0.356322 |
228 rows × 10 columns
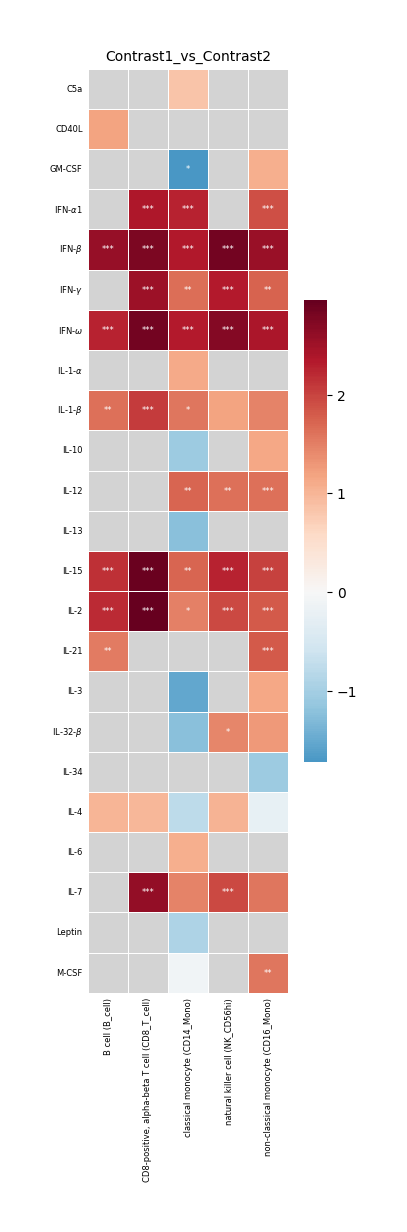
#### Create heatmap to visualize up-/down regulation of cytokines in all queried cell types for one contrast comparison.

robust_results_dict = hc.get_robust_significant_results(
    results=all_enrichment_results,
    alphas=[0.1, 0.05, 0.01],
    threshold_valid=0.1,
    threshold_below_alpha=0.9,
    display_df_nicely=True,
)


contrast_one = all_enrichment_results.contrast.unique()[0]  # Can be looked up manually
print(f"Contrast that was plotted in this example: {contrast_one}")

hc.plot_significant_results(
    results_pivot=robust_results_dict[contrast_one][0],
    df_annot=robust_results_dict[contrast_one][1],
    fontsize=6,
    save_fig=False,
    fig_path="",
)
100%|█████████████████████████████████████████████| 2/2 [00:00<00:00,  5.63it/s]
100%|█████████████████████████████████████████████| 2/2 [00:00<00:00,  5.81it/s]
100%|█████████████████████████████████████████████| 2/2 [00:00<00:00,  5.90it/s]
Contrast:flare_vs_na
Contrast:flare_vs_treated
Contrast that was plotted in this example: flare_vs_na
| celltype_combo | B cell (B_cell) | CD8-positive, alpha-beta T cell (CD8_T_cell) | classical monocyte (CD14_Mono) | natural killer cell (NK_CD56hi) | non-classical monocyte (CD16_Mono) |
|---|---|---|---|---|---|
| cytokine | |||||
| C5a | NaN | NaN | 0.824626 | NaN | NaN |
| CD40L | 1.178586 | NaN | NaN | NaN | NaN |
| GM-CSF | NaN | NaN | -1.716415 | NaN | 1.067157 |
| IFN-alpha1 | NaN | 2.381374 | 2.275001 | NaN | 1.899060 |
| IFN-beta | 2.562403 | 2.766936 | 2.369340 | 2.833250 | 2.547490 |
| IFN-gamma | NaN | 2.523393 | 1.653163 | 2.343129 | 1.737921 |
| IFN-omega | 2.273263 | 2.842103 | 2.340306 | 2.709487 | 2.394353 |
| IL-1-alpha | NaN | NaN | 1.128863 | NaN | NaN |
| IL-1-beta | 1.631260 | 2.065306 | 1.574989 | 1.173449 | 1.468500 |
| IL-10 | NaN | NaN | -1.064040 | NaN | 1.147024 |
| IL-12 | NaN | NaN | 1.718149 | 1.611605 | 1.615538 |
| IL-13 | NaN | NaN | -1.239344 | NaN | NaN |
| IL-15 | 2.141593 | 2.918858 | 1.712834 | 2.278749 | 2.014931 |
| IL-2 | 2.200793 | 2.960634 | 1.495469 | 1.944788 | 1.819644 |
| IL-21 | 1.543598 | NaN | NaN | NaN | 1.793556 |
| IL-3 | NaN | NaN | -1.518474 | NaN | 1.140749 |
| IL-32-beta | NaN | NaN | -1.237959 | 1.443350 | 1.264760 |
| IL-34 | NaN | NaN | NaN | NaN | -1.074666 |
| IL-4 | 0.988177 | 0.980630 | -0.781461 | 1.027170 | -0.237768 |
| IL-6 | NaN | NaN | 1.063259 | NaN | NaN |
| IL-7 | NaN | 2.607919 | 1.477653 | 1.940822 | 1.580144 |
| Leptin | NaN | NaN | -0.895441 | NaN | NaN |
| M-CSF | NaN | NaN | -0.099254 | NaN | 1.587646 |
| celltype_combo | B cell (B_cell) | CD8-positive, alpha-beta T cell (CD8_T_cell) | classical monocyte (CD14_Mono) | natural killer cell (NK_CD56hi) | non-classical monocyte (CD16_Mono) |
|---|---|---|---|---|---|
| cytokine | |||||
| C5a | NaN | NaN | -1.189803 | NaN | NaN |
| CD40L | -1.693557 | NaN | NaN | NaN | NaN |
| GM-CSF | NaN | NaN | -1.388974 | NaN | -0.683133 |
| IFN-alpha1 | NaN | -2.130195 | -0.899155 | NaN | -2.101700 |
| IFN-beta | 0.115822 | -1.838215 | -1.376248 | -2.254063 | -2.194528 |
| IFN-gamma | NaN | -2.105842 | -1.343798 | -1.531173 | -2.026200 |
| IFN-omega | -0.053542 | -2.068641 | -1.418638 | -2.128074 | -2.010313 |
| IL-1-alpha | NaN | NaN | -1.813962 | NaN | NaN |
| IL-1-beta | -1.906926 | -2.296600 | -1.419371 | -1.816670 | -2.131353 |
| IL-10 | NaN | NaN | 0.227970 | NaN | 1.368964 |
| IL-12 | NaN | NaN | -1.029728 | 1.313715 | -1.206941 |
| IL-13 | NaN | NaN | -0.949737 | NaN | NaN |
| IL-15 | 0.231294 | -1.358315 | -1.407049 | -0.029734 | -1.796427 |
| IL-2 | 1.102760 | -1.469871 | -1.510644 | 1.313041 | -1.515681 |
| IL-21 | -1.060919 | NaN | NaN | NaN | 1.287729 |
| IL-3 | NaN | NaN | -1.452649 | NaN | 0.833354 |
| IL-32-beta | NaN | NaN | -1.407760 | -1.148784 | 1.073192 |
| IL-34 | NaN | NaN | NaN | NaN | -1.215203 |
| IL-4 | 1.424639 | 0.626373 | -1.456163 | 1.290428 | -0.660090 |
| IL-6 | NaN | NaN | 1.037916 | NaN | NaN |
| IL-7 | NaN | -1.425252 | -1.161532 | -1.247459 | -1.287995 |
| Leptin | NaN | NaN | -1.243239 | NaN | NaN |
| M-CSF | NaN | NaN | -1.548185 | NaN | 1.030975 |
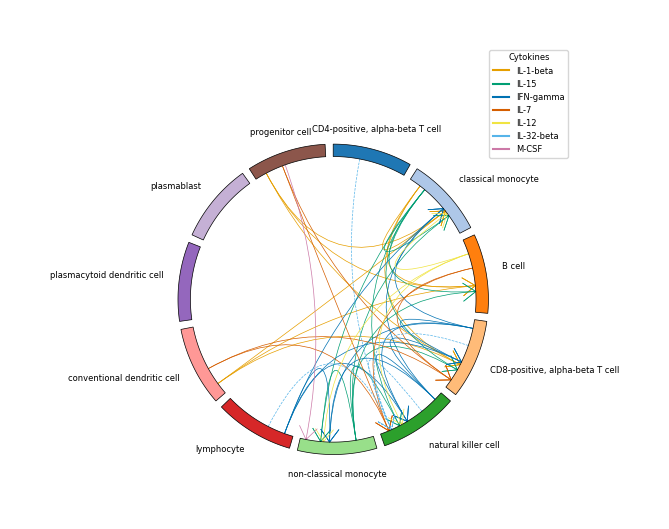
#### Cell-cell communication

cytokine_info = hc.load_cytokine_info()
expression_threshold = 0.1 / 10_000  # = 100 TPM
expression_threshold = np.log2((expression_threshold) + 1)

# Compute cytokine senders and receivers per cell type.
df_senders, df_receivers = hc.get_all_senders_and_receivers(
    adata=adata,
    cytokine_info=cytokine_info,
    cytokine_list=robust_results_dict[contrast_one][2].cytokine.unique(),
    celltype_colname=your_celltype_colname,
    sender_pvalue_threshold=0.1,
    receiver_mean_X_threshold=0,
)

# Plots cell-cell communication
legend_handles, legend_labels = hc.plot_communication(
    df_src=df_senders,
    df_tgt=df_receivers,
    frac_expressing_cells_sender=0,
    frac_expressing_cells_receiver=0,
    mean_cytokine_gene_expression_sender=expression_threshold,
    mean_cytokine_gene_expression_receiver=expression_threshold,
    df_enrichment=robust_results_dict[contrast_one][2],
    all_celltypes=np.array(adata.obs[your_celltype_colname].unique()),
    show_legend=True,
    figsize=(6, 7),
    lw=0.5,
    fontsize=6,
    bbox_to_anchor=(1.1, 1.1),
    loc="center",
)
Loading from: /ictstr01/home/icb/jenni.liu/all_projects/cytokine_dict_project/cytokine_info.xlsx
None of the cytokine producing genes (['IFNW1']) were found in dataset for cytokine IFN-omega.
None of the cytokine producing genes (['IFNA1']) were found in dataset for cytokine IFN-alpha1.
No receptor gene found in cytokine_info for cytokine: IL-32-beta
end = time.time()
print(f"Time: {int((end - start) / 60)} min {int((end - start) % 60)} sec")
Time: 16 min 3 sec
## --END-- ##