Multiple Sclerosis – Cytokine-induced Programs#
import time
import warnings
from tqdm import TqdmWarning

import hucira as hc

warnings.simplefilter("ignore", TqdmWarning)

start = time.time()
/lustre/groups/ml01/workspace/jenni.liu/conda_extern/envs/hucira/lib/python3.11/site-packages/tqdm/auto.py:21: TqdmWarning: IProgress not found. Please update jupyter and ipywidgets. See https://ipywidgets.readthedocs.io/en/stable/user_install.html
  from .autonotebook import tqdm as notebook_tqdm
Cytokine-induced Immune Programs#
From the Human Cytokine Dictionary, we derived 82 Cytokine-induced Immune Programs (CIP). This tutorial guides you through the enrichment analysis of these gene sets. Your query data should be a transcriptomic data object in AnnData’s .h5ad format with gene symbols in .var axis and metadata describing immune celltypes and experimental conditions of samples.
1. Load input data#
The two main input files for this tool are:
the Cytokine-induced Immune Programs (CIP)
your transcriptome data object
Explore their metadata annotation for cell types and disease condition.
#### Load the file containing our derived cytokine-induced immune programs

cip_sig = hc.load_CIP_signatures()

print(f"All celltypes in signatures:\n  {cip_sig.celltype.unique()}")
print("\n")
print(f"All CIP in signatures:\n  {cip_sig.CIP.unique()}")
cip_sig
Loading from: /ictstr01/home/icb/jenni.liu/all_projects/cytokine_dict_project/huCIRA/docs/notebooks/CIP_signatures.csv
All celltypes in signatures:
  ['Treg' 'CD4_T_cell' 'CD8_T_cell' 'cDC' 'MAIT' 'CD14_Mono' 'CD16_Mono'
 'B_cell' 'NK_CD56hi' 'NK_CD56low' 'NKT' 'HSPC']


All CIP in signatures:
  ['MD-05 CellInteraction' 'CS-05 ImmuneReg' 'PD-05 BcellAct'
 'CS-03 MixedCytokine' 'CS-04 Recruitment-3' 'II-10 Complement'
 'SN-04 NeuralComm' 'FC-06 ImmuneMod' 'TR-02 TissueRepair'
 'MD-06 IntegrinSignal' 'II-01 PatternRecog' 'MD-08 TissueRemodel'
 'II-19 MonoStress' 'II-23 cDC-Suppress' 'II-20 MyeloidMetab'
 'ES-01 OxidativeStress' 'SN-03 SynapticSignal' 'FC-01 ScavengerComp'
 'FC-07 Phagocytosis' 'II-27 ChemokineRemodel' 'CS-09 ECM'
 'II-02 PathogenSense' 'II-03 ImmuneHomeo' 'TR-04 AntiInflam'
 'II-04 MyeloidActive' 'II-05 ViralResponse' 'II-06 AntiInflam'
 'GR-01 lncRNA-Reg' 'GR-04 CellSignal' 'GR-02 GeneExpStress'
 'IT-02 IonChannel' 'II-11 InnateActive' 'PD-03 BcellDiff-1'
 'II-14 MonoActive-1' 'CE-08 NK-Immuno' 'MD-01 AdhesionECM-1'
 'CS-10 Metabolic' 'CE-03 Cytotoxic-2' 'CS-08 MyeloidRemodel'
 'CE-01 Cytotoxic-1' 'FC-02 PhagocyteComp' 'MD-02 SignalTraffic'
 'II-07 InnateInflam' 'MD-03 AntigenProc' 'II-08 ActivationTraffic'
 'PD-04 BcellReg' 'MD-11 AdhesionECM-2' 'CS-06 Inflammatory'
 'SN-02 SynapticAdhesion' 'CE-04 LymphoAdhesion' 'II-29 MyeloidLipid'
 'MD-09 InflamResolve' 'TR-03 InflamResolve' 'PD-08 BcellProlif'
 'MD-07 ECM-Remodel' 'PD-12 ImmuneProlif' 'II-21 InnateMigration'
 'FC-03 PatternRecog' 'CE-02 CellActive' 'II-15 MonoActive-2'
 'CS-07 LymphoidHoming' 'PD-10 Transcriptional' 'PD-02 CellGrowth'
 'II-09 CytokineProd' 'GR-03 ImmuneReg' 'CE-06 EffectorTraffic'
 'FC-04 ComplementR' 'SN-01 SynapticPlastic' 'II-16 MonoActive-3'
 'PD-01 CellCycle' 'II-13 InflamReg' 'II-17 MonoActive-4'
 'II-28 APCPriming' 'II-18 MonoRemodel' 'CS-01 Recruitment-1'
 'II-12 StressResponse' 'TR-01 Type2Immune' 'MD-04 CellMigration'
 'CS-02 Recruitment-2' 'II-25 IFN-Induction' 'FC-05 IgE-Humoral'
 'PD-11 BcellSignal']
| gene | CIP | effect_size | celltype | |
|---|---|---|---|---|
| 0 | MEOX1 | MD-05 CellInteraction | 0.120686 | Treg |
| 1 | MEOX1 | MD-05 CellInteraction | 0.120686 | CD4_T_cell |
| 2 | MEOX1 | MD-05 CellInteraction | 0.120686 | CD8_T_cell |
| 3 | MEOX1 | MD-05 CellInteraction | 0.120686 | cDC |
| 4 | MEOX1 | MD-05 CellInteraction | 0.120686 | MAIT |
| ... | ... | ... | ... | ... |
| 104131 | HNF1B | PD-11 BcellSignal | 0.166682 | B_cell |
| 104132 | ENSG00000286277 | PD-11 BcellSignal | 0.112509 | B_cell |
| 104133 | ENSG00000286364 | PD-11 BcellSignal | 0.563512 | B_cell |
| 104134 | ENSG00000286546 | PD-11 BcellSignal | 0.253321 | B_cell |
| 104135 | ENSG00000287943 | PD-11 BcellSignal | 0.192738 | B_cell |
104136 rows × 4 columns
#### Load the query adata object

adata = hc.load_multiple_sclerosis_data()
adata
Loading from: /ictstr01/home/icb/jenni.liu/all_projects/cytokine_dict_project/huCIRA/docs/notebooks/MS_CSF.h5ad
AnnData object with n_obs × n_vars = 65326 × 10266
    obs: 'labels', 'MS', 'CSF', 'valid_clusters', 'CD4_labels'
    obsm: 'X_umap'
#### Optional for easy workflow:
# Enter celltype column name and condition column name

your_celltype_colname = "labels"
your_contrast_colname = "MS"


# Check data size (Are the conditions you want to contrast of comparable size?)
adata.obs[your_contrast_colname].value_counts()
MS
True     35483
False    29843
Name: count, dtype: int64
# Enrichment analysis needs two main information from query adata: cell types and disease conditions.
# They have to be chosen manually, because annotation of objects differs.

print(f"All celltypes in query data:\n  {sorted(adata.obs[your_celltype_colname].unique())}\n")
print(
    f"All experimental states (contrasts/conditions) in query data:\n  {sorted(adata.obs[your_contrast_colname].unique())}\n"
)
All celltypes in query data:
  ['B cell doublets', 'B1', 'B2', 'CD4', 'CD8a', 'CD8n', 'Gran', 'MegaK', 'Mono', 'Mono Doublet', 'NK1', 'NK2', 'RBC', 'Tdg', 'Tregs', 'contamination1', 'doublet', 'mDC1', 'mDC2', 'ncMono', 'pDC', 'plasma']

All experimental states (contrasts/conditions) in query data:
  ['False', 'True']
2. Process and prepare input data parameters#
Convert ENSG to gene symbols if necessary
Because there is no standard nomenclature for cell types, we have to manually create “celltype_combos”, the data container that matches the cell types of your query data to the cell types in the CIP.
Choose the experimental conditions of interest (“contrasts”)
#### Create celltype_combos. An input parameter for the enrichment analysis.

adata_celltypes = ["B1", "CD8a", "Mono"]
CIP_celltypes = ["B_cell", "CD8_T_cell", "CD14_Mono"]

celltype_combos = hc.create_celltype_combos(adata_celltypes, CIP_celltypes)
celltype_combos
(('B1', 'B_cell'), ('CD8a', 'CD8_T_cell'), ('Mono', 'CD14_Mono'))
#### Define conditions of interest:

contrasts = [("True", "False")]
3. Run enrichment analysis#
The main analysis is done by run_one_enrichment_test(), which computes enrichment scores of one query celltype and different conditions.
This simple example returns an example of the main outcome of this cytokine enrichment score analysis.
run_one_enrichment_test() returns enrichment results for one celltype and contrast.
get_robust_significant_results() returns the robust and significant results from that initial enrichment analysis.
enrichment_results = hc.run_one_enrichment_test(
    adata=adata,
    df=cip_sig,
    contrasts_combo=contrasts,
    celltype_combo=celltype_combos[0],
    contrast_column=your_contrast_colname,
    celltype_column=your_celltype_colname,
    direction="upregulated",
    threshold_lfc=1.0,
    threshold_expression=0.05,
    threshold_pval=0.01,
)

enrichment_results[
    [
        "celltype_combo",
        "CIP",
        "contrast",
        "direction",
        "ES",
        "NES",
        "NOM p-val",
        "FDR q-val",
        "FWER p-val",
        "frac_shared_genes_signature",
    ]
].sort_values("NES", ascending=False)
Computing gene sets of Cytokine-induced gene programs for B_cell.
Using precomputed stats
True_vs_False
| celltype_combo | CIP | contrast | direction | ES | NES | NOM p-val | FDR q-val | FWER p-val | frac_shared_genes_signature | |
|---|---|---|---|---|---|---|---|---|---|---|
| 0 | B1 (B_cell) | PD-05 BcellAct | True_vs_False | upregulated | 0.554781 | 1.95207 | 0.0 | 0.0 | 0.0 | 0.508380 |
| 1 | B1 (B_cell) | PD-08 BcellProlif | True_vs_False | upregulated | 0.517229 | 1.912568 | 0.0 | 0.0 | 0.0 | 0.268102 |
| 2 | B1 (B_cell) | PD-11 BcellSignal | True_vs_False | upregulated | 0.546199 | 1.798589 | 0.0 | 0.0 | 0.0 | 0.358025 |
| 3 | B1 (B_cell) | FC-05 IgE-Humoral | True_vs_False | upregulated | 0.424371 | 1.583758 | 0.001056 | 0.001586 | 0.006 | 0.386700 |
| 4 | B1 (B_cell) | PD-03 BcellDiff-1 | True_vs_False | upregulated | 0.372912 | 1.499887 | 0.0 | 0.005288 | 0.022 | 0.301955 |
| 5 | B1 (B_cell) | PD-04 BcellReg | True_vs_False | upregulated | 0.369261 | 1.498489 | 0.0 | 0.004583 | 0.023 | 0.262981 |
| 6 | B1 (B_cell) | PD-10 Transcriptional | True_vs_False | upregulated | 0.330519 | 1.28669 | 0.024896 | 0.046533 | 0.24 | 0.340220 |
#### Lastly, get robust and significant results from previous enrichment_results

robust_results_dict = hc.get_robust_significant_results(
    results=enrichment_results,
    alphas=[0.1, 0.05, 0.01],
    threshold_valid=0.1,
    threshold_below_alpha=0.9,
    display_df_nicely=True,
)
100%|██████████████████████████████████████████████████████████████████████| 1/1 [00:00<00:00,  4.18it/s]
100%|██████████████████████████████████████████████████████████████████████| 1/1 [00:00<00:00, 40.47it/s]
100%|██████████████████████████████████████████████████████████████████████| 1/1 [00:00<00:00, 41.89it/s]
Contrast:True_vs_False
| celltype_combo | B1 (B_cell) |
|---|---|
| CIP | |
| FC-05 IgE-Humoral | 1.583758 |
| PD-03 BcellDiff-1 | 1.499887 |
| PD-04 BcellReg | 1.498489 |
| PD-05 BcellAct | 1.952070 |
| PD-08 BcellProlif | 1.912568 |
| PD-10 Transcriptional | 1.286690 |
| PD-11 BcellSignal | 1.798589 |
4. Visualization of results#
run_all_enrichment_test() iterates the enrichment analysis over several cell types and gene set thresholds for the enrichment analysis, resuting in more robust results. The output is ideal for visualization of:
Heatmaps, representing normalized enrichment scores and significant annotations.
Cell-cell communication plot, representing cell communication through cytokines.
#### Run more robust enrichment analysis on a several celltypes and conditions:

all_enrichment_results = hc.run_all_enrichment_test(
    adata=adata,
    df=cip_sig,
    contrasts_combo=contrasts,
    celltype_combos=celltype_combos,
    contrast_column=your_contrast_colname,
    celltype_column=your_celltype_colname,
    direction="upregulated",
    threshold_lfc=[0.8, 1],
    threshold_expression=[0.05, 0.01],
)

# Look at all enrichment results (reduced view to columns of interest, not all statistics)
all_enrichment_results[
    [
        "celltype_combo",
        "CIP",
        "contrast",
        "direction",
        "ES",
        "NES",
        "NOM p-val",
        "FDR q-val",
        "FWER p-val",
        "frac_shared_genes_signature",
    ]
].sort_values("NES", ascending=False)
Computing gene sets of Cytokine-induced gene programs for B_cell.
Using precomputed stats
True_vs_False
Computing gene sets of Cytokine-induced gene programs for B_cell.
Using precomputed stats
True_vs_False
Computing gene sets of Cytokine-induced gene programs for B_cell.
Using precomputed stats
True_vs_False
Computing gene sets of Cytokine-induced gene programs for B_cell.
Using precomputed stats
True_vs_False
Computing gene sets of Cytokine-induced gene programs for CD8_T_cell.
2025-12-20 00:55:08,455 [WARNING] Duplicated values found in preranked stats: 0.02% of genes
The order of those genes will be arbitrary, which may produce unexpected results.
Using precomputed stats
True_vs_False
Computing gene sets of Cytokine-induced gene programs for CD8_T_cell.
2025-12-20 00:55:09,434 [WARNING] Duplicated values found in preranked stats: 0.01% of genes
The order of those genes will be arbitrary, which may produce unexpected results.
Using precomputed stats
True_vs_False
Computing gene sets of Cytokine-induced gene programs for CD8_T_cell.
2025-12-20 00:55:10,420 [WARNING] Duplicated values found in preranked stats: 0.02% of genes
The order of those genes will be arbitrary, which may produce unexpected results.
Using precomputed stats
True_vs_False
Computing gene sets of Cytokine-induced gene programs for CD8_T_cell.
2025-12-20 00:55:11,363 [WARNING] Duplicated values found in preranked stats: 0.01% of genes
The order of those genes will be arbitrary, which may produce unexpected results.
Using precomputed stats
True_vs_False
Computing gene sets of Cytokine-induced gene programs for CD14_Mono.
2025-12-20 00:55:12,249 [WARNING] Duplicated values found in preranked stats: 0.02% of genes
The order of those genes will be arbitrary, which may produce unexpected results.
Using precomputed stats
True_vs_False
Computing gene sets of Cytokine-induced gene programs for CD14_Mono.
2025-12-20 00:55:13,382 [WARNING] Duplicated values found in preranked stats: 0.02% of genes
The order of those genes will be arbitrary, which may produce unexpected results.
Using precomputed stats
True_vs_False
Computing gene sets of Cytokine-induced gene programs for CD14_Mono.
2025-12-20 00:55:14,901 [WARNING] Duplicated values found in preranked stats: 0.02% of genes
The order of those genes will be arbitrary, which may produce unexpected results.
Using precomputed stats
True_vs_False
Computing gene sets of Cytokine-induced gene programs for CD14_Mono.
2025-12-20 00:55:16,647 [WARNING] Duplicated values found in preranked stats: 0.02% of genes
The order of those genes will be arbitrary, which may produce unexpected results.
Using precomputed stats
True_vs_False
| celltype_combo | CIP | contrast | direction | ES | NES | NOM p-val | FDR q-val | FWER p-val | frac_shared_genes_signature | |
|---|---|---|---|---|---|---|---|---|---|---|
| 0 | CD8a (CD8_T_cell) | CE-02 CellActive | True_vs_False | upregulated | 0.667066 | 2.235164 | 0.0 | 0.0 | 0.0 | 0.627660 |
| 0 | CD8a (CD8_T_cell) | CE-02 CellActive | True_vs_False | upregulated | 0.667066 | 2.235164 | 0.0 | 0.0 | 0.0 | 0.627660 |
| 0 | CD8a (CD8_T_cell) | CE-02 CellActive | True_vs_False | upregulated | 0.683809 | 2.152049 | 0.0 | 0.0 | 0.0 | 0.760638 |
| 0 | CD8a (CD8_T_cell) | CE-02 CellActive | True_vs_False | upregulated | 0.683809 | 2.152049 | 0.0 | 0.0 | 0.0 | 0.760638 |
| 1 | CD8a (CD8_T_cell) | CE-01 Cytotoxic-1 | True_vs_False | upregulated | 0.620282 | 2.119862 | 0.0 | 0.0 | 0.0 | 0.375000 |
| ... | ... | ... | ... | ... | ... | ... | ... | ... | ... | ... |
| 3 | Mono (CD14_Mono) | II-13 InflamReg | True_vs_False | upregulated | -0.314762 | -1.566444 | 0.0 | 0.139665 | 0.057075 | 0.246407 |
| 3 | CD8a (CD8_T_cell) | SN-02 SynapticAdhesion | True_vs_False | upregulated | -0.497492 | -1.697427 | 0.0 | 0.008532 | 0.012077 | 0.445946 |
| 3 | CD8a (CD8_T_cell) | SN-02 SynapticAdhesion | True_vs_False | upregulated | -0.497492 | -1.697427 | 0.0 | 0.008532 | 0.012077 | 0.445946 |
| 2 | CD8a (CD8_T_cell) | SN-02 SynapticAdhesion | True_vs_False | upregulated | -0.56604 | -1.871217 | 0.0 | 0.003984 | 0.006944 | 0.310811 |
| 2 | CD8a (CD8_T_cell) | SN-02 SynapticAdhesion | True_vs_False | upregulated | -0.56604 | -1.871217 | 0.0 | 0.003984 | 0.006944 | 0.310811 |
248 rows × 10 columns
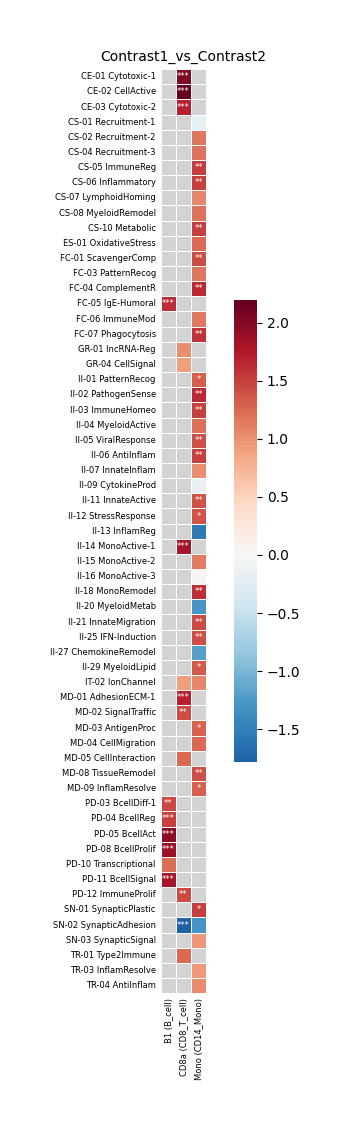
#### Create heatmap to visualize up-/down regulation of cytokines in all queried cell types for one contrast comparison.

robust_results_dict = hc.get_robust_significant_results(
    results=all_enrichment_results,
    alphas=[0.1, 0.05, 0.01],
    threshold_valid=0.1,
    threshold_below_alpha=0.9,
    display_df_nicely=True,
)


contrast_one = all_enrichment_results.contrast.unique()[0]  # Can be looked up manually
print(f"Contrast that was plotted in this example: {contrast_one}")

hc.plot_significant_results(
    results_pivot=robust_results_dict[contrast_one][0],
    df_annot=robust_results_dict[contrast_one][1],
    fontsize=6,
    save_fig=False,
    fig_path="",
    fig_width=18,
    fig_height=12,
)
100%|██████████████████████████████████████████████████████████████████████| 1/1 [00:00<00:00,  3.76it/s]
100%|██████████████████████████████████████████████████████████████████████| 1/1 [00:00<00:00,  3.98it/s]
100%|██████████████████████████████████████████████████████████████████████| 1/1 [00:00<00:00,  4.07it/s]
Contrast:True_vs_False
Contrast that was plotted in this example: True_vs_False
| celltype_combo | B1 (B_cell) | CD8a (CD8_T_cell) | Mono (CD14_Mono) |
|---|---|---|---|
| CIP | |||
| CE-01 Cytotoxic-1 | NaN | 2.043945 | NaN |
| CE-02 CellActive | NaN | 2.193607 | NaN |
| CE-03 Cytotoxic-2 | NaN | 1.700025 | NaN |
| CS-01 Recruitment-1 | NaN | NaN | -0.198897 |
| CS-02 Recruitment-2 | NaN | NaN | 1.178291 |
| ... | ... | ... | ... |
| SN-02 SynapticAdhesion | NaN | -1.784322 | -1.287101 |
| SN-03 SynapticSignal | NaN | NaN | 0.970276 |
| TR-01 Type2Immune | NaN | 1.255946 | NaN |
| TR-03 InflamResolve | NaN | NaN | 0.939346 |
| TR-04 AntiInflam | NaN | NaN | 1.043193 |
61 rows × 3 columns
end = time.time()
print(f"Time: {int((end - start) / 60)} min {int((end - start) % 60)} sec")
Time: 0 min 33 sec
## --END-- ##