Cell-cell communication of cytokine signalling#
The tutorial quick_start_cytokine_enrichment shows you how the enrichment analysis is run in more detail. This tutorial shows how to compute and visualize cytokine-mediated cell-cell communication using huCIRA.
# Import core packages and the hucira package.

import os
import time
import warnings

import numpy as np
from tqdm import TqdmWarning

import hucira as hc

warnings.simplefilter("ignore", TqdmWarning)

start = time.time()
current_wd = os.getcwd()
print(current_wd)
/ictstr01/home/icb/jenni.liu/all_projects/cytokine_dict_project/huCIRA/docs/notebooks
Quick start cytokine signaling#
Given a list of cytokines, get_all_senders_and_receivers identifies which cell types act as senders (produce the cytokine) and which act as receivers (express the corresponding receptor). This helps to map potential cytokine-mediated communication between immune cell types in your dataset.
Note: these signals reflect expression potential only and are not filtered for significance or robustness in this quick start tutorial.
If you know which cytokines you’re interested in, you can define them and run cell-cell communication analysis directly. If you want to explore enriched signals in your query data, run the full enrichment analysis first and enter the output of all enriched signals after filtering of robust signals as a parameter to plot_communication(tutorial in second part).
For a quick start, follow these steps:
Load cytokine information file from huCIRA.
Define the cytokine(s) for which you want to compute signaling. They must be present in the cytokine information file to define sender and receiver relationships. The function will then identify which genes are in your query data as well.
Load your query adata. It needs to have feature names saved under
adata.var.indexin HGNC format to match nomenclature of cytokine info file.Adjust threshold as needed. More about that in the advanced tutorial.
The files are saved to or loaded from the current working directory current_wd. The path is explicitly specified here, although it’s also the default saving location if left unspecified.
# Load cytokine info file

cytokine_info = hc.load_cytokine_info(save_dir=current_wd)
cytokine_info.head()
| Unnamed: 0 | name | gene | used cytokines | DEG_plot_family | single_family | family_level_1 | family_level_2 | receptor gene | alternative names | comments | parse_cytokine | single_gene | go_annotations | go_labels | functional_classification | |
|---|---|---|---|---|---|---|---|---|---|---|---|---|---|---|---|---|
| 0 | 0 | IL-1-alpha | IL1A | IL-1α | IL-1 | IL-1 | interleukin | IL-1 | IL1R1, IL1RAP | Interleukin 1 alpha | NaN | True | IL1A | ['GO:0005125', 'GO:0046688', 'GO:0034605', 'GO... | cytokine activity, extracellular space, positi... | Pro-inflammatory |
| 1 | 1 | IL-1-beta | IL1B | IL-1β | IL-1 | IL-1 | interleukin | IL-1 | IL1R1, IL1RAP | Interleukin 1 beta | NaN | True | IL1B | ['GO:0005125', 'GO:0070372', 'GO:0001934', 'GO... | cytokine activity, positive regulation of prot... | Pro-inflammatory |
| 2 | 2 | IL-1Ra | IL1RN | IL-1Ra | IL-1 | IL-1 | interleukin | IL-1 | IL1R1 | Interleukin 1 receptor antagonist | NaN | True | IL1RN | ['GO:0006953', 'GO:0005813', 'GO:0005149', 'GO... | extracellular space, protein binding, cytosol,... | Anti-inflammatory |
| 3 | 3 | IL-18 | IL18 | IL-18 | IL-1 | IL-1 | interleukin | IL-1 | IL18R1, IL18RAP | Interleukin 18 | NaN | True | IL18 | ['GO:0005125', 'GO:0005615', 'GO:0032819', 'GO... | cytokine activity, extracellular space, positi... | Pro-inflammatory, Th1-associated |
| 4 | 4 | IL-33 | IL33 | IL-33 | IL-1 | IL-1 | interleukin | IL-1 | IL1RL1, IL1RAP | Interleukin 33 | NaN | True | IL33 | ['GO:0005125', 'GO:0005737', 'GO:0005615', 'GO... | cytokine activity, cytoplasm, extracellular sp... | Pro-inflammatory |
print("All cytokines present in the file:")
print(cytokine_info.name.unique())
All cytokines present in the file:
['IL-1-alpha' 'IL-1-beta' 'IL-1Ra' 'IL-18' 'IL-33' 'IL-36-alpha'
 'IL-36-beta' 'IL-36-gamma' 'IL-36Ra' 'IL-37' 'IL-38' 'IL-2' 'IL-7' 'IL-9'
 'IL-15' 'IL-21' 'IL-4' 'IL-13' 'IL-3' 'IL-5' 'GM-CSF' 'IL-6' 'IL-11'
 'IL-27' 'IL-30' 'IL-31' 'LIF' 'OSM' 'CT-1' 'IL-12' 'IL-23' 'IL-35'
 'IL-10' 'IL-19' 'IL-20' 'IL-22' 'IL-24' 'IL-26' 'IL-17A' 'IL-17B'
 'IL-17C' 'IL-17D' 'IL-17E' 'IL-17F' 'IL-16' 'IL-32-beta' 'TSLP'
 'IFN-alpha1' 'IFN-alpha2' 'IFN-alpha4' 'IFN-alpha5' 'IFN-alpha6'
 'IFN-alpha7' 'IFN-alpha8' 'IFN-alpha10' 'IFN-alpha13' 'IFN-alpha14'
 'IFN-alpha16' 'IFN-alpha17' 'IFN-alpha21' 'IFN-beta' 'IFN-epsilon'
 'IFN-kappa' 'IFN-omega' 'IFN-gamma' 'IFN-lambda1' 'IFN-lambda2'
 'IFN-lambda3' 'IFN-lambda4' 'TNF-alpha' 'LT-alpha1-beta2'
 'LT-alpha2-beta1' 'FasL' 'TRAIL' 'CD27L' 'CD30L' 'CD40L' 'OX40L' '4-1BBL'
 'GITRL' 'APRIL' 'BAFF' 'LIGHT' 'TL1A' 'RANKL' 'TWEAK' 'EDA' 'C1q' 'C3a'
 'C4a' 'C4b' 'C5a' 'Properdin' 'M-CSF' 'G-CSF' 'TGF-beta1' 'TGF-beta2'
 'TGF-beta3' 'BMP2' 'BMP4' 'BMP6' 'BMP7' 'GDF5' 'GDF15' 'EGF' 'TGF-alpha'
 'FGF-alpha' 'FGF-beta' 'FGF7' 'FGF9' 'FGF21' 'PDGF-AA' 'PDGF-BB'
 'PDGF-CC' 'PDGF-DD' 'VEGF' 'VEGF-B' 'VEGF-C' 'VEGF-D' 'IGF-1' 'IGF-2'
 'GDNF' 'PSPN' 'HGF' 'SCF' 'FLT3L' 'IL-34' 'EPO' 'MYDGF' 'PRL' 'Leptin'
 'ADSF' 'Noggin' 'Decorin' 'TPO' 'CXCL1' 'CXCL2' 'CXCL3' 'CXCL5' 'CXCL6'
 'CXCL7' 'IL-8' 'CXCL14' 'CXCL4' 'CXCL4V1' 'CXCL9' 'CXCL10' 'CXCL11'
 'CXCL12' 'CXCL13' 'CXCL16' 'CXCL17' 'CCL1' 'CCL2' 'CCL3' 'CCL3L1'
 'CCL3L3' 'CCL4' 'CCL4L1' 'CCL4L2' 'CCL5' 'CCL7' 'CCL8' 'CCL11' 'CCL13'
 'CCL14a' 'CCL15' 'CCL16' 'CCL17' 'CCL18' 'CCL19' 'CCL20' 'CCL21' 'CCL22'
 'CCL23' 'CCL24' 'CCL25' 'CCL26' 'CCL27' 'CCL28' 'CX3CL1' 'XCL1' 'XCL2']
# Load your query data

adata = hc.load_multiple_sclerosis_data(save_dir=current_wd)
adata
AnnData object with n_obs × n_vars = 65326 × 10266
    obs: 'labels', 'MS', 'CSF', 'valid_clusters', 'CD4_labels'
    obsm: 'X_umap'
# Compute senders and receivers for (a) chosen cytokine(s) in your query data

df_senders, df_receivers = hc.get_all_senders_and_receivers(
    adata=adata,
    cytokine_info=cytokine_info,
    cytokine_list=["IL-15", "IL-7"],
    celltype_colname="labels",
    sender_pvalue_threshold=0.1,
    receiver_mean_X_threshold=0.1,
)
df_senders
| min_logfoldchanges | min_pvals | min_pvals_adj | gene | mean_X | frac_X | mean_X>0 | cytokine | celltype | |
|---|---|---|---|---|---|---|---|---|---|
| Gran | 1.655668 | 0.0 | 0.0 | IL15 | 0.083014 | 0.062886 | 0.083014 | IL-15 | Gran |
| Mono | 2.027854 | 0.000022 | 0.000022 | IL15 | 0.122385 | 0.113548 | 0.122385 | IL-15 | Mono |
| Mono Doublet | 1.321865 | 0.000265 | 0.000265 | IL15 | 0.077380 | 0.086847 | 0.077380 | IL-15 | Mono Doublet |
| ncMono | 2.071975 | 0.0 | 0.0 | IL15 | 0.122466 | 0.115276 | 0.122466 | IL-15 | ncMono |
| B1 | 2.646197 | 0.087981 | 0.087981 | IL7 | 0.038835 | 0.024137 | 0.038835 | IL-7 | B1 |
| B2 | 3.863949 | 0.000447 | 0.000447 | IL7 | 0.086458 | 0.063812 | 0.086458 | IL-7 | B2 |
df_receivers
| mean_X | frac_X | cytokine | celltype | |
|---|---|---|---|---|
| labels | ||||
| B cell doublets | 0.140399 | 0.120690 | IL-15 | B cell doublets |
| CD8a | 0.207754 | 0.127662 | IL-15 | CD8a |
| Mono Doublet | 0.117080 | 0.118044 | IL-15 | Mono Doublet |
| NK1 | 0.909494 | 0.465402 | IL-15 | NK1 |
| NK2 | 0.914678 | 0.533137 | IL-15 | NK2 |
| Tdg | 0.198221 | 0.127036 | IL-15 | Tdg |
| Tregs | 0.117986 | 0.084524 | IL-15 | Tregs |
| contamination1 | 0.101549 | 0.047091 | IL-15 | contamination1 |
| B cell doublets | 0.923470 | 0.596552 | IL-7 | B cell doublets |
| CD4 | 0.715459 | 0.447919 | IL-7 | CD4 |
| CD8a | 0.864174 | 0.417114 | IL-7 | CD8a |
| CD8n | 0.692757 | 0.456908 | IL-7 | CD8n |
| Mono Doublet | 0.435859 | 0.422428 | IL-7 | Mono Doublet |
| NK2 | 0.914678 | 0.496318 | IL-7 | NK2 |
| Tdg | 0.951255 | 0.536645 | IL-7 | Tdg |
| Tregs | 0.902313 | 0.529644 | IL-7 | Tregs |
| contamination1 | 0.934714 | 0.387812 | IL-7 | contamination1 |
| doublet | 0.650651 | 0.590476 | IL-7 | doublet |
| mDC1 | 0.167398 | 0.151163 | IL-7 | mDC1 |
| pDC | 0.107447 | 0.080597 | IL-7 | pDC |
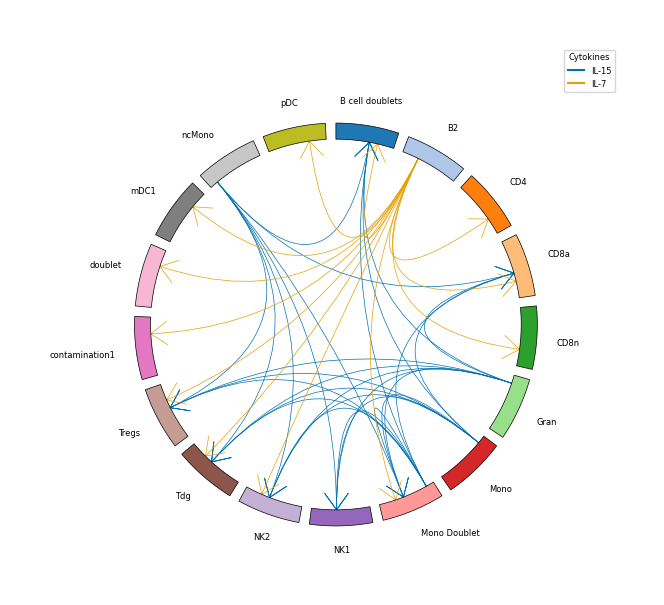
# Plots cell-cell communication

expression_threshold = 0.05

legend_handles, legend_labels = hc.plot_communication(
    df_src=df_senders,
    df_tgt=df_receivers,
    mean_cytokine_gene_expression_sender=expression_threshold,
    mean_cytokine_gene_expression_receiver=expression_threshold,
    show_legend=True,
    figsize=(6, 7),
    lw=0.5,
    fontsize=6,
    bbox_to_anchor=(1.1, 1.1),
    loc="center",
)
Run a full enrichment analysis to visualize enriched and significant cytokine signals#
To explore biologically relevant signals in your dataset in a more unbiased way, it is helpful to first run the enrichment analysis.
run_all_enrichment_test() is a wrapper around the core function run_one_enrichment_test() and performs enrichment analyses across multiple cell types and across different filtering parameters used during gene set construction. In contrast, run_one_enrichment_test() focuses on a single specified cell type and does not allow assessment of robustness with respect to gene set construction parameters. More details are provided in the advanced tutorial.
In short, the wrapper returns results in a format that allows for more comprehensive downstream visualization, such as cell–cell communication plots.
For this cell–cell communication tutorial, we will compute enriched signals across a few selected cell types and then filter the results to keep only robust and statistically significant signals for visualization. To see how enrichment analyses are ran, refer to the quick start tutorial and/or the advanced tutorial.
# Load the human cytokine dictionary (mini version).

df_hcd_all = hc.load_human_cytokine_dict(save_dir=current_wd, mini_version=True)
# Enter celltype column name and condition column name of your query adata
your_celltype_colname = "labels"
your_contrast_colname = "MS"

# Define celltype_combos, an input parameter for enrichment testing
adata_celltypes = ["B1", "CD8a", "Mono"]
hcd_celltypes = ["B_cell", "CD8_T_cell", "CD14_Mono"]

celltype_combos = hc.create_celltype_combos(adata_celltypes, hcd_celltypes)
print(celltype_combos)

# Define conditions of interest
contrast = ("True", "False")
print(contrast)
[('B1', 'B_cell'), ('CD8a', 'CD8_T_cell'), ('Mono', 'CD14_Mono')]
('True', 'False')
# Run robust enrichment analysis on a several celltypes and gene set parameters:

all_enrichment_results = hc.run_all_enrichment_test(
    adata=adata,
    df=df_hcd_all,
    contrast_combo=contrast,
    celltype_combos=celltype_combos,
    contrast_column=your_contrast_colname,
    celltype_column=your_celltype_colname,
    direction="upregulated",
    threshold_lfc=[0.8],
    threshold_expression=[0.05],
    threshold_pval=0.01,
)

# Look at all enrichment results (reduced view to columns of interest, not all statistics)
all_enrichment_results[
    [
        "celltype_combo",
        "cytokine",
        "contrast",
        "direction",
        "ES",
        "NES",
        "NOM p-val",
        "FDR q-val",
        "FWER p-val",
        "frac_shared_genes_signature",
        "Lead_genes",
        "threshold_lfc",
        "threshold_expression",
    ]
].sort_values("NES", ascending=False)
| celltype_combo | cytokine | contrast | direction | ES | NES | NOM p-val | FDR q-val | FWER p-val | frac_shared_genes_signature | Lead_genes | threshold_lfc | threshold_expression | |
|---|---|---|---|---|---|---|---|---|---|---|---|---|---|
| 0 | CD8a (CD8_T_cell) | IL-2 | True_vs_False | upregulated | 0.612847 | 2.079503 | 0.0 | 0.0 | 0.0 | 0.509091 | ACTB;HSPA8;PRF1;IL32;UBB;PFN1;ACTG1;MYL12A;GZM... | 0.8 | 0.05 |
| 1 | CD8a (CD8_T_cell) | IL-15 | True_vs_False | upregulated | 0.57136 | 2.022814 | 0.0 | 0.0 | 0.0 | 0.498920 | ACTB;HSPA8;PRF1;IL32;PFN1;ACTG1;MYL12A;HNRNPF;... | 0.8 | 0.05 |
| 2 | CD8a (CD8_T_cell) | IL-7 | True_vs_False | upregulated | 0.539797 | 1.830362 | 0.0 | 0.0 | 0.0 | 0.407186 | ACTB;HSPA8;PRF1;IL32;MYL12A;TAP1;ENO1;GZMB;PSM... | 0.8 | 0.05 |
| 0 | B1 (B_cell) | IL-21 | True_vs_False | upregulated | 0.604502 | 1.560405 | 0.019305 | 0.117342 | 0.1 | 0.246154 | ACTB;CD180;ACTG1;ITGB2;PNP;MYO1G;CD19 | 0.8 | 0.05 |
| 0 | Mono (CD14_Mono) | M-CSF | True_vs_False | upregulated | 0.443602 | 1.542205 | 0.0 | 0.126455 | 0.12 | 0.286533 | AP1S2;DUSP6;BCL2A1;KCNN4;GIMAP6;HSP90AB1;ADAP2... | 0.8 | 0.05 |
| 1 | B1 (B_cell) | CD40L | True_vs_False | upregulated | 0.604784 | 1.518806 | 0.021684 | 0.09108 | 0.146 | 0.200000 | TLR10;MARCKSL1;ANXA6;VIM | 0.8 | 0.05 |
| 3 | CD8a (CD8_T_cell) | IL-1-beta | True_vs_False | upregulated | 0.507223 | 1.509405 | 0.011173 | 0.031313 | 0.089 | 0.517241 | TAP1;MT-CO1;PSME2;GAPDH;STOM;IFITM2;ISG15;GBP1... | 0.8 | 0.05 |
| 4 | CD8a (CD8_T_cell) | IFN-omega | True_vs_False | upregulated | 0.452022 | 1.507522 | 0.002064 | 0.02549 | 0.09 | 0.406015 | HSPA8;PRF1;TAP1;PSME2;IFI16;IFITM2;ALOX5AP;PGA... | 0.8 | 0.05 |
| 5 | CD8a (CD8_T_cell) | IL-1-alpha | True_vs_False | upregulated | 0.614064 | 1.498569 | 0.029446 | 0.023439 | 0.1 | 0.375000 | ISG15;GBP1;APOL2;EPSTI1;MX1;GBP5;PARP9;RTP4;FB... | 0.8 | 0.05 |
| 2 | B1 (B_cell) | IL-7 | True_vs_False | upregulated | 0.637046 | 1.444307 | 0.054161 | 0.129635 | 0.276 | 0.133333 | HSPA8;TNFSF10;MX1 | 0.8 | 0.05 |
| 6 | CD8a (CD8_T_cell) | IFN-beta | True_vs_False | upregulated | 0.416523 | 1.420999 | 0.003061 | 0.046616 | 0.218 | 0.423631 | HSPA8;PRF1;MYL12A;TAP1;CD164;PSMB8;STOM;IFI16;... | 0.8 | 0.05 |
| 2 | Mono (CD14_Mono) | IL-13 | True_vs_False | upregulated | 0.413988 | 1.397061 | 0.028322 | 0.267065 | 0.383 | 0.211699 | CD52;PTPRE;TRAF3IP3;SCIMP;FBP1;MAT2A;CD1D;SESN... | 0.8 | 0.05 |
| 3 | Mono (CD14_Mono) | IL-3 | True_vs_False | upregulated | 0.420398 | 1.396357 | 0.035599 | 0.178673 | 0.384 | 0.233677 | DUSP6;HSPA8;BCL2A1;KCNN4;PNPLA6;FBP1;SLC27A3;C... | 0.8 | 0.05 |
| 3 | B1 (B_cell) | IL-1-beta | True_vs_False | upregulated | 0.43831 | 1.365439 | 0.067836 | 0.190542 | 0.445 | 0.525641 | RPS26;ACTB;NOP10;ACTG1;SIPA1;TNFSF10;PCBP1;TAP... | 0.8 | 0.05 |
| 4 | B1 (B_cell) | IL-2 | True_vs_False | upregulated | 0.522763 | 1.36093 | 0.08872 | 0.158244 | 0.451 | 0.271186 | HSPA8;CLIC1;TNFSF10 | 0.8 | 0.05 |
| 5 | B1 (B_cell) | IFN-omega | True_vs_False | upregulated | 0.41305 | 1.306813 | 0.10095 | 0.200972 | 0.602 | 0.300000 | HSPA8;PRELID1;TNFSF10;TYMP;MX1;PCBP1;FCHSD2;CH... | 0.8 | 0.05 |
| 4 | Mono (CD14_Mono) | IL-1-beta | True_vs_False | upregulated | 0.353617 | 1.285755 | 0.045128 | 0.373938 | 0.707 | 0.389831 | C3AR1;DUSP6;INSIG1;MS4A7;TNFSF10;GCH1;LILRB1;C... | 0.8 | 0.05 |
| 7 | CD8a (CD8_T_cell) | IFN-gamma | True_vs_False | upregulated | 0.419743 | 1.283557 | 0.120482 | 0.141732 | 0.51 | 0.462185 | TAP1;PSMB8;ISG15;GBP1;OASL;CASP1;GBP2;IFITM1;B... | 0.8 | 0.05 |
| 5 | Mono (CD14_Mono) | IL-4 | True_vs_False | upregulated | 0.349172 | 1.259552 | 0.058462 | 0.365209 | 0.767 | 0.264476 | HLA-DRB5;CD52;TRAF3IP3;SCIMP;CHCHD10;FBP1;CD18... | 0.8 | 0.05 |
| 6 | Mono (CD14_Mono) | GM-CSF | True_vs_False | upregulated | 0.362683 | 1.230153 | 0.15229 | 0.37559 | 0.833 | 0.207595 | DUSP6;TRAF3IP3;BCL2A1;KCNN4;FBP1;SLC27A3;CISD3... | 0.8 | 0.05 |
| 7 | Mono (CD14_Mono) | IL-15 | True_vs_False | upregulated | 0.333228 | 1.214327 | 0.09165 | 0.361704 | 0.865 | 0.331570 | DUSP6;RNF149;HSPA8;TNFSF10;GCH1;PTPRE;BCL2A1;D... | 0.8 | 0.05 |
| 9 | Mono (CD14_Mono) | IL-7 | True_vs_False | upregulated | 0.352927 | 1.207278 | 0.150923 | 0.332062 | 0.877 | 0.230769 | TNFSF10;GCH1;BCL2A1;KCNN4;FBP1;SERPINB9;BTG1;I... | 0.8 | 0.05 |
| 8 | CD8a (CD8_T_cell) | IFN-alpha1 | True_vs_False | upregulated | 0.432258 | 1.201905 | 0.199074 | 0.23207 | 0.696 | 0.508197 | ISG15;OASL;BST2;EPSTI1;MX1;GBP5;LAP3;PARP9;RTP... | 0.8 | 0.05 |
| 9 | CD8a (CD8_T_cell) | IL-27 | True_vs_False | upregulated | 0.527981 | 1.198174 | 0.241255 | 0.215125 | 0.702 | 0.392857 | GBP1;GBP2;EPSTI1;IRF1;GBP5;PARP9;GBP4;FBXO6;STAT1 | 0.8 | 0.05 |
| 10 | CD8a (CD8_T_cell) | IL-4 | True_vs_False | upregulated | 0.39526 | 1.129785 | 0.299312 | 0.300944 | 0.834 | 0.340000 | PTGER2;IMMT;ID2;CD226;PTGDR;CISH;VCL;BATF;XBP1... | 0.8 | 0.05 |
| 7 | B1 (B_cell) | IL-4 | True_vs_False | upregulated | 0.309784 | 1.117536 | 0.276619 | 0.492838 | 0.937 | 0.368243 | ACTB;CD180;IL4R;SYPL1;GRK6;EVI2A;CYSLTR1;CD40;... | 0.8 | 0.05 |
| 10 | Mono (CD14_Mono) | IL-6 | True_vs_False | upregulated | 0.426901 | 1.079522 | 0.357236 | 0.672539 | 0.988 | 0.168675 | CD14;MTSS1;HMOX1;ADGRE1;CD300E | 0.8 | 0.05 |
| 11 | Mono (CD14_Mono) | IL-2 | True_vs_False | upregulated | 0.291784 | 1.048299 | 0.400621 | 0.714281 | 0.998 | 0.279352 | DUSP6;RNF149;INSIG1;TNFSF10;GCH1;BCL2A1;KCNN4;... | 0.8 | 0.05 |
| 8 | B1 (B_cell) | IFN-beta | True_vs_False | upregulated | 0.296887 | 1.043391 | 0.421111 | 0.580006 | 0.977 | 0.360656 | HSPA8;MYL12A;RAN;TNFSF10;PSMA4;TYMP;UNC93B1;MX... | 0.8 | 0.05 |
| 13 | Mono (CD14_Mono) | IFN-beta | True_vs_False | upregulated | 0.249525 | 0.955876 | 0.667 | 0.956133 | 1.0 | 0.370980 | GIMAP4;INSIG1;RAB10;TNFSF10;HLA-B;CFD;GCH1;DNA... | 0.8 | 0.05 |
| 14 | Mono (CD14_Mono) | IL-12 | True_vs_False | upregulated | 0.324546 | 0.948705 | 0.574341 | 0.896194 | 1.0 | 0.185897 | TNFSF10;GCH1;MYOF;VAMP5;LRRK2;JAK2;GLS;KCNMA1;... | 0.8 | 0.05 |
| 9 | B1 (B_cell) | IL-15 | True_vs_False | upregulated | 0.285618 | 0.935012 | 0.59838 | 0.721562 | 0.997 | 0.344371 | HSPA8;TNFSF10;TYMP;UNC93B1;PCBP1;TAP1;ENO1;CAR... | 0.8 | 0.05 |
| 15 | Mono (CD14_Mono) | IFN-gamma | True_vs_False | upregulated | 0.258536 | 0.933028 | 0.626159 | 0.867399 | 1.0 | 0.296375 | INSIG1;GCH1;BCL2A1;IRF1;SNX10;SERPINB9;BTG1;MY... | 0.8 | 0.05 |
| 16 | Mono (CD14_Mono) | IFN-alpha1 | True_vs_False | upregulated | 0.297473 | 0.915052 | 0.61015 | 0.848043 | 1.0 | 0.258065 | TNFSF10;GCH1;IFIT3;SAMD9;ISG15;C6orf47;APOL2;C... | 0.8 | 0.05 |
| 11 | CD8a (CD8_T_cell) | IL-32-beta | True_vs_False | upregulated | 0.390356 | 0.884804 | 0.642857 | 0.695752 | 0.997 | 0.196429 | GNLY;CD7;MT-CO2;CXCR6;HIF1A;MIAT;ARID5A | 0.8 | 0.05 |
| 17 | Mono (CD14_Mono) | IL-32-beta | True_vs_False | upregulated | 0.233987 | 0.884189 | 0.805416 | 0.858383 | 1.0 | 0.282110 | RNF149;SLC16A3;HCK;LILRB1;TNFRSF8;LYST;TRAF3IP... | 0.8 | 0.05 |
| 18 | Mono (CD14_Mono) | Leptin | True_vs_False | upregulated | 0.333247 | 0.856392 | 0.68401 | 0.855045 | 1.0 | 0.484848 | RHOB;EGR1;ARSA;MAPK7;NBEAL2 | 0.8 | 0.05 |
| 19 | Mono (CD14_Mono) | IFN-omega | True_vs_False | upregulated | 0.222289 | 0.848093 | 0.881 | 0.816961 | 1.0 | 0.333594 | INSIG1;RAB10;TNFSF10;GCH1;BCL2A1;SLFN5;DYNLT1;... | 0.8 | 0.05 |
| 10 | B1 (B_cell) | IL-34 | True_vs_False | upregulated | 0.338078 | 0.77143 | 0.790026 | 0.897724 | 1.0 | 0.833333 | TPI1;AIP;PPIA;BRMS1;DYNLL2 | 0.8 | 0.05 |
| 11 | B1 (B_cell) | IL-13 | True_vs_False | upregulated | 0.2549 | 0.766178 | 0.801453 | 0.821498 | 1.0 | 0.372093 | IL4R;JCHAIN;BLOC1S6;GCSAM;LAIR1;PHF20L1;SYT17;... | 0.8 | 0.05 |
| 20 | Mono (CD14_Mono) | IL-1-alpha | True_vs_False | upregulated | 0.241813 | 0.691372 | 0.889029 | 0.936877 | 1.0 | 0.198473 | GCH1;VAMP5;APOL2;LILRA2;SFMBT2;MAP3K7CL;TNF;IS... | 0.8 | 0.05 |
| 12 | Mono (CD14_Mono) | IL-10 | True_vs_False | upregulated | -0.227726 | -1.023002 | 0.373134 | 0.40135 | 0.581114 | 0.229050 | CXCR4;MAP3K8;TESC;FOS;NEAT1;MXD1;NINJ2 | 0.8 | 0.05 |
| 6 | B1 (B_cell) | IL-32-beta | True_vs_False | upregulated | -0.407307 | -1.172439 | 0.272321 | 0.245712 | 0.448276 | 0.225806 | MT-CO2;SLC2A3;TP53INP1;PTPN1;SPOCK2 | 0.8 | 0.05 |
| 8 | Mono (CD14_Mono) | IL-34 | True_vs_False | upregulated | -0.404031 | -1.213996 | 0.230435 | 0.258567 | 0.319613 | 0.520000 | FOS;CDKN1A;MT-ND4L;EIF4H | 0.8 | 0.05 |
| 1 | Mono (CD14_Mono) | C5a | True_vs_False | upregulated | -0.439019 | -1.434618 | 0.084211 | 0.176012 | 0.123487 | 0.180180 | DDIT4;DUSP1;MSR1 | 0.8 | 0.05 |
robust_results = hc.check_robustness(
    all_results=all_enrichment_results,
    threshold_qval=0.15,  # chosen leniently to visualize more cytokines
    threshold_valid=0.0,
    threshold_below_alpha=0.0,
)
robust_results
| celltype_combo | contrast | cytokine | frac_valid | frac_significant | is_robust | NES_min | NES_max | FDR q-val | qval_threshold | threshold_frac_below_alpha | |
|---|---|---|---|---|---|---|---|---|---|---|---|
| 0 | B1 (B_cell) | True_vs_False | IL-21 | 1.0 | 1.0 | True | 1.560405 | 1.560405 | 0.117342 | 0.15 | 0.0 |
| 1 | B1 (B_cell) | True_vs_False | CD40L | 1.0 | 1.0 | True | 1.518806 | 1.518806 | 0.091080 | 0.15 | 0.0 |
| 2 | B1 (B_cell) | True_vs_False | IL-7 | 1.0 | 1.0 | True | 1.444307 | 1.444307 | 0.129635 | 0.15 | 0.0 |
| 3 | CD8a (CD8_T_cell) | True_vs_False | IL-2 | 1.0 | 1.0 | True | 2.079503 | 2.079503 | 0.000000 | 0.15 | 0.0 |
| 4 | CD8a (CD8_T_cell) | True_vs_False | IL-15 | 1.0 | 1.0 | True | 2.022814 | 2.022814 | 0.000000 | 0.15 | 0.0 |
| 5 | CD8a (CD8_T_cell) | True_vs_False | IL-7 | 1.0 | 1.0 | True | 1.830362 | 1.830362 | 0.000000 | 0.15 | 0.0 |
| 6 | CD8a (CD8_T_cell) | True_vs_False | IL-1-beta | 1.0 | 1.0 | True | 1.509405 | 1.509405 | 0.031313 | 0.15 | 0.0 |
| 7 | CD8a (CD8_T_cell) | True_vs_False | IFN-omega | 1.0 | 1.0 | True | 1.507522 | 1.507522 | 0.025490 | 0.15 | 0.0 |
| 8 | CD8a (CD8_T_cell) | True_vs_False | IL-1-alpha | 1.0 | 1.0 | True | 1.498569 | 1.498569 | 0.023439 | 0.15 | 0.0 |
| 9 | CD8a (CD8_T_cell) | True_vs_False | IFN-beta | 1.0 | 1.0 | True | 1.420999 | 1.420999 | 0.046616 | 0.15 | 0.0 |
| 10 | CD8a (CD8_T_cell) | True_vs_False | IFN-gamma | 1.0 | 1.0 | True | 1.283557 | 1.283557 | 0.141732 | 0.15 | 0.0 |
| 11 | Mono (CD14_Mono) | True_vs_False | M-CSF | 1.0 | 1.0 | True | 1.542205 | 1.542205 | 0.126455 | 0.15 | 0.0 |
cytokines_IL_family = [
    "IL-1-alpha",
    "IL-1-beta",
    "IL-10",
    "IL-11",
    "IL-12",
    "IL-13",
    "IL-15",
    "IL-16",
    "IL-17A",
    "IL-17B",
    "IL-17C",
    "IL-17D",
    "IL-17E",
    "IL-17F",
    "IL-18",
    "IL-19",
    "IL-1Ra",
    "IL-2",
    "IL-20",
    "IL-21",
    "IL-22",
    "IL-23",
    "IL-24",
    "IL-26",
    "IL-27",
    "IL-3",
    "IL-31",
    "IL-32-beta",
    "IL-33",
    "IL-34",
    "IL-35",
    "IL-36-alpha",
    "IL-36Ra",
    "IL-4",
    "IL-5",
    "IL-6",
    "IL-7",
    "IL-8",
    "IL-9",
]
print(f"Num of cytokines to be plotted: {len(cytokines_IL_family)}")
Num of cytokines to be plotted: 39
# Compute cytokine senders and receivers per cell type for cytokines
df_senders, df_receivers = hc.get_all_senders_and_receivers(
    adata=adata,
    cytokine_info=cytokine_info,
    cytokine_list=cytokines_IL_family,
    celltype_colname=your_celltype_colname,
    sender_pvalue_threshold=0.1,
    receiver_mean_X_threshold=0,
)
df_senders
| min_logfoldchanges | min_pvals | min_pvals_adj | gene | mean_X | frac_X | mean_X>0 | cytokine | celltype | |
|---|---|---|---|---|---|---|---|---|---|
| Mono Doublet | 3.002076 | 0.000001 | 0.000001 | IL10 | 0.101699 | 0.091906 | 0.101699 | IL-10 | Mono Doublet |
| ncMono | 5.035968 | 0.0 | 0.0 | IL10 | 0.267259 | 0.190240 | 0.267259 | IL-10 | ncMono |
| Gran | 1.655668 | 0.0 | 0.0 | IL15 | 0.083014 | 0.062886 | 0.083014 | IL-15 | Gran |
| Mono | 2.027854 | 0.000022 | 0.000022 | IL15 | 0.122385 | 0.113548 | 0.122385 | IL-15 | Mono |
| Mono Doublet | 1.321865 | 0.000265 | 0.000265 | IL15 | 0.077380 | 0.086847 | 0.077380 | IL-15 | Mono Doublet |
| ncMono | 2.071975 | 0.0 | 0.0 | IL15 | 0.122466 | 0.115276 | 0.122466 | IL-15 | ncMono |
| B cell doublets | 0.849211 | 0.000001 | 0.000001 | IL16 | 0.489709 | 0.406897 | 0.489709 | IL-16 | B cell doublets |
| B2 | 0.476345 | 0.000042 | 0.000042 | IL16 | 0.396229 | 0.278757 | 0.396229 | IL-16 | B2 |
| CD4 | 0.246106 | 0.0 | 0.0 | IL16 | 0.329181 | 0.223700 | 0.329181 | IL-16 | CD4 |
| CD8a | 0.276222 | 0.00017 | 0.00017 | IL16 | 0.345714 | 0.212637 | 0.345714 | IL-16 | CD8a |
| CD8n | 0.220238 | 0.004193 | 0.004193 | IL16 | 0.341423 | 0.241108 | 0.341423 | IL-16 | CD8n |
| NK1 | 0.36612 | 0.009205 | 0.009205 | IL16 | 0.369055 | 0.206519 | 0.369055 | IL-16 | NK1 |
| NK2 | 0.572691 | 0.000256 | 0.000256 | IL16 | 0.419261 | 0.284242 | 0.419261 | IL-16 | NK2 |
| Tregs | 0.614972 | 0.0 | 0.0 | IL16 | 0.422423 | 0.282153 | 0.422423 | IL-16 | Tregs |
| mDC1 | 0.830383 | 0.000079 | 0.000079 | IL16 | 0.485559 | 0.534884 | 0.485559 | IL-16 | mDC1 |
| mDC2 | 0.087196 | 0.000206 | 0.000206 | IL16 | 0.317319 | 0.318229 | 0.317319 | IL-16 | mDC2 |
| pDC | 0.316756 | 0.014826 | 0.014826 | IL16 | 0.363058 | 0.316418 | 0.363058 | IL-16 | pDC |
| plasma | 0.318229 | 0.000002 | 0.000002 | IL16 | 0.363582 | 0.528169 | 0.363582 | IL-16 | plasma |
| Gran | 1.596265 | 0.0 | 0.0 | IL18 | 0.119207 | 0.093933 | 0.119207 | IL-18 | Gran |
| Mono Doublet | 3.090332 | 0.0 | 0.0 | IL18 | 0.321317 | 0.310287 | 0.321317 | IL-18 | Mono Doublet |
| NK2 | 1.827364 | 0.00061 | 0.00061 | IL18 | 0.158988 | 0.113402 | 0.158988 | IL-18 | NK2 |
| mDC1 | 2.412863 | 0.000042 | 0.000042 | IL18 | 0.234040 | 0.302326 | 0.234040 | IL-18 | mDC1 |
| mDC2 | 4.309805 | 0.0 | 0.0 | IL18 | 0.596492 | 0.507724 | 0.596492 | IL-18 | mDC2 |
| ncMono | 4.584363 | 0.0 | 0.0 | IL18 | 0.627767 | 0.474540 | 0.627767 | IL-18 | ncMono |
| pDC | 1.433939 | 0.012034 | 0.012034 | IL18 | 0.125188 | 0.119403 | 0.125188 | IL-18 | pDC |
| CD4 | 1.484981 | 0.0 | 0.0 | IL23A | 0.077779 | 0.056323 | 0.077779 | IL-23 | CD4 |
| Tregs | 0.889414 | 0.009471 | 0.009471 | IL23A | 0.082812 | 0.060201 | 0.082812 | IL-23 | Tregs |
| B2 | 4.24254 | 0.033334 | 0.033334 | EBI3 | 0.049518 | 0.038623 | 0.049518 | IL-27 | B2 |
| ncMono | 5.026896 | 0.000027 | 0.000027 | EBI3 | 0.067088 | 0.067185 | 0.067088 | IL-27 | ncMono |
| CD4 | 1.400319 | 0.0 | 0.0 | IL32 | 2.174868 | 0.877435 | 2.174868 | IL-32-beta | CD4 |
| CD8a | 2.089652 | 0.0 | 0.0 | IL32 | 2.747685 | 0.944876 | 2.747685 | IL-32-beta | CD8a |
| CD8n | 0.582261 | 0.0 | 0.0 | IL32 | 2.006130 | 0.900821 | 2.006130 | IL-32-beta | CD8n |
| Tdg | 1.732243 | 0.0 | 0.0 | IL32 | 2.721018 | 0.956026 | 2.721018 | IL-32-beta | Tdg |
| Tregs | 1.624697 | 0.0 | 0.0 | IL32 | 2.617443 | 0.916084 | 2.617443 | IL-32-beta | Tregs |
| contamination1 | 0.820463 | 0.0 | 0.0 | IL32 | 2.164150 | 0.686981 | 2.164150 | IL-32-beta | contamination1 |
| B2 | 4.24254 | 0.033334 | 0.033334 | EBI3 | 0.049518 | 0.038623 | 0.049518 | IL-35 | B2 |
| ncMono | 5.026896 | 0.000027 | 0.000027 | EBI3 | 0.067088 | 0.067185 | 0.067088 | IL-35 | ncMono |
| B1 | 2.646197 | 0.087981 | 0.087981 | IL7 | 0.038835 | 0.024137 | 0.038835 | IL-7 | B1 |
| B2 | 3.863949 | 0.000447 | 0.000447 | IL7 | 0.086458 | 0.063812 | 0.086458 | IL-7 | B2 |
df_receivers
| mean_X | frac_X | cytokine | celltype | |
|---|---|---|---|---|
| B1 | 0.099969 | 0.062755 | IL-10 | B1 |
| B2 | 0.152840 | 0.115029 | IL-10 | B2 |
| B cell doublets | 0.133764 | 0.131034 | IL-10 | B cell doublets |
| CD4 | 0.114350 | 0.081498 | IL-10 | CD4 |
| CD8a | 0.121640 | 0.077910 | IL-10 | CD8a |
| ... | ... | ... | ... | ... |
| mDC1 | 0.167398 | 0.151163 | IL-7 | mDC1 |
| mDC2 | 0.072470 | 0.072091 | IL-7 | mDC2 |
| ncMono | 0.048336 | 0.043140 | IL-7 | ncMono |
| pDC | 0.107447 | 0.080597 | IL-7 | pDC |
| plasma | 0.084467 | 0.133803 | IL-7 | plasma |
208 rows × 4 columns
# Plots cell-cell communication: all enrichment results

# Define a minimum expression threshold of genes
expression_threshold = 0.1 / 10_000  # 100 transcripts per million
expression_threshold = np.log2((expression_threshold) + 1)
print(f"expression_threshold is {expression_threshold}")

# All celltypes in query data:
all_query_data_ct = np.array(adata.obs[your_celltype_colname].unique())

legend_handles, legend_labels = hc.plot_communication(
    df_src=df_senders,
    df_tgt=df_receivers,
    frac_expressing_cells_sender=0,
    frac_expressing_cells_receiver=0,
    mean_cytokine_gene_expression_sender=expression_threshold,
    mean_cytokine_gene_expression_receiver=expression_threshold,
    df_enrichment=all_enrichment_results,
    all_celltypes=all_query_data_ct,
    show_legend=True,
    figsize=(6, 7),
    lw=0.5,
    fontsize=6,
    bbox_to_anchor=(1.1, 1.1),
    loc="center",
)
expression_threshold is 1.4426878274712997e-05
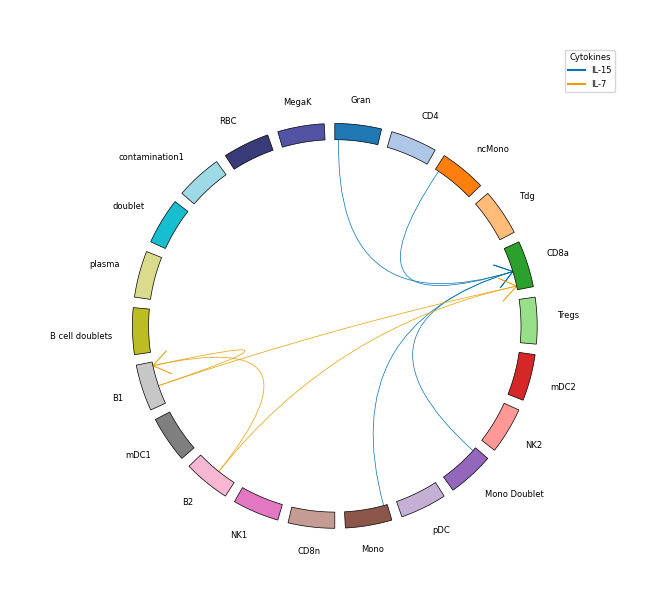
# Plots cell-cell communication: only robust and statistically significant results

# Define a minimum expression threshold of genes
expression_threshold = 0.1 / 10_000  # 100 transcripts per million
expression_threshold = np.log2((expression_threshold) + 1)
print(f"expression_threshold is {expression_threshold}")

# All celltypes in query data:
all_query_data_ct = np.array(adata.obs[your_celltype_colname].unique())


legend_handles, legend_labels = hc.plot_communication(
    df_src=df_senders,
    df_tgt=df_receivers,
    frac_expressing_cells_sender=0,
    frac_expressing_cells_receiver=0,
    mean_cytokine_gene_expression_sender=expression_threshold,
    mean_cytokine_gene_expression_receiver=expression_threshold,
    df_enrichment=robust_results,
    all_celltypes=all_query_data_ct,
    show_legend=True,
    figsize=(6, 7),
    lw=0.5,
    fontsize=6,
    bbox_to_anchor=(1.1, 1.1),
    loc="center",
)
expression_threshold is 1.4426878274712997e-05
end = time.time()
print(f"Time: {int((end - start) / 60)} min {int((end - start) % 60)} sec")
Time: 0 min 36 sec
## --END-- ##